Exercise / Step 4.6 / Capacity project – Business Plan
Learn how to create a business plan in a professional manner.
You know how to analyze a capacity investment, build the base case, introduce residual value and WCR, and integrate changes in selling prices and costs.
Now, you have to build your whole business plan and make the link between business and financial forecasts (P&L and balance sheet), cash flows and value creation. Showing the results to your Capex controller will very much improve the efficiency of your interaction!
Download and open the frame spreadsheet.
It’s a new case, presented slightly differently, but with the same structure.
First, you get the data.
You need to buy a machine:
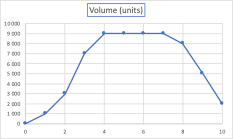
The market volume is not constant: up, stable and down (traditional process):
You are provided with:
- Selling price per unit (and inflation on selling prices)
- Variable cost per unit (and inflation on cost)
- Fixed costs (and inflation on costs – same as variable costs)
The characteristics of the working capital requirement are:
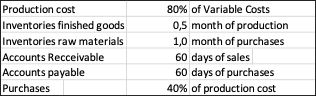
Last but not least, you need to know the WACC and the tax rate.
Now, you are ready to forecast the financials of your project.
Start with the P&L.
The sales figure in year n is the volume multiplied by the inflated unit selling price (see step 4.5 inflation). The unit selling price in year 0 (when you build your BP) is $300.
Exercise Summary
0 of 12 Questions completed
Questions:
Information
You have already completed the exercise before. Hence you can not start it again.
Exercise is loading…
You must sign in or sign up to start the exercise.
You must first complete the following:
Results
Results
0 of 12 Questions answered correctly
Your time:
Time has elapsed
You have reached 0 of 0 point(s), (0)
Earned Point(s): 0 of 0, (0)
0 Essay(s) Pending (Possible Point(s): 0)
Categories
- Not categorized 0%
- 1
- 2
- 3
- 4
- 5
- 6
- 7
- 8
- 9
- 10
- 11
- 12
- Current
- Review
- Answered
- Correct
- Incorrect
-
Question 1 of 12
1. Question
What is the sales figure in year 7?
Same process for the variable costs.
CorrectIncorrect -
Question 2 of 12
2. Question
What is the variable cost per unit in year 5?
CorrectIncorrect -
Question 3 of 12
3. Question
What are the fixed costs in year 8?
CorrectIncorrect -
Question 4 of 12
4. Question
What is the EBITDA in year 2?
The annual depreciation is simply the cost of the machine divided by the number of years.
CorrectIncorrect -
Question 5 of 12
5. Question
What is the EBIT in year 5?
CorrectIncorrect -
Question 6 of 12
6. Question
The next step is about the balance sheet.
Of course, we limit the balance sheet forecast to the calculation of net fixed assets, working capital requirement (WCR) and total capital employed (CE).
Net fixed assets are calculated subtracting accumulated depreciation from gross fixed assets. Gross fixed assets is the cost of acquiring the machine (line 29). The machine is acquired at the end of year 0 and appears in the balance sheet year 0. No change up to the end of the project, when it is sold for its residual value. So, at the end of year 10, the figure is 0 again (machine sold).
In year 1, the machine is depreciated a first time, then the accumulated depreciation is simply the depreciation of the year. Year 2 shows 2 years of accumulated depreciation, etc.
What is the amount of net fixed assets at the end of year 6 (column H)?
CorrectIncorrect -
Question 7 of 12
7. Question
To calculate the WCR, you refer to Step 4.3.
Same calculation, except that I introduced inventory or raw materials to make it more realistic. To be even more realistic, there should be work-in-progress, too.
You position the WCR of year 1 at the end of year 0, which is a simplification. The WCR will be altered each year by activity and inflation.
You observe that the WCR is up, because of growing sales, then down and ends at nil, as it disappears with the activity.
The total capital employed (CE) is the sum of net fixed assets and WCR.
You can, now, run a financial analysis of your project, year by year, because you have calculated different profits generated by operations (contribution margin, EBITDA and EBIT) and funds invested in business operations (CE).
Three ratios of commercial profitability are suggested (a profit divided by sales), two ratios of assets productivity (WCR as a percentage to sales and Assets Turn-Over = sales divided by capital employed) and the ultimate operating performance, the Return-On-Capital-Employed (ROCE).
The so-called DuPont formula and its financial and business consequences (ROCE = ROS (EBIT) * ATO) are developed in:
- Module 4 Financial Issues: Boosting performance with operational levers
- Educational film March 2020: the DuPont-de-Nemours formula
- Educational film April 2020: MVNO, a new business model in a capital-intensive industry
- Educational film May 2020: McDonald’s & Starbucks
You observe that the ROCE is initially negative as you reach the accounting breakeven only in year 3, then increases a lot, because EBIT increases and CE is down, then turns very negative in year 10 because the EBIT is again negative and CE is marginal.
At the end of year 4, the WCR is ?
CorrectIncorrect -
Question 8 of 12
8. Question
The last step consists in discounting cash flows to estimate the value which is created (or destroyed…) by the project.
It’s the easiest part, because you already have calculated all critical figures.
The incremental EBITDA (line 76) is already available line 40!
Then, the question is: can you calculate DEBITDA * (1 – CTR) when DEBITDA is negative? The answer is ‘yes’ if you assume that the project is run by a company which is generating enough profit so that the negative DEBITDA generates tax savings. This should be, obviously, checked in ‘real life’. If it’s not the case, then you must carry forward the losses…
Tax savings on depreciation (line 80) is the same as in Step 4.1 base case.
No specific issue on Capex (cell B84).
A difficulty on the DWCR. You remember (Step 4.3) that we considered, first, an increase in the WCR (cash out) in year 0, and, second, the recovery (cash in) of the WCR at the end of the project. The situation, here, is more realistic, but more complex, as the WCR changes from one year to the other. We have to apply the same principle.
The project WCR was initially nil, so, in year 0, you increase the WCR by ‘cell B57’ and you consume the same amount in cash ‘cell B86’. In year 1, the WCR is up by the difference between WCR1 and WCR0. This increase is an additional cash consumption (cash out) which will show ‘cell C86’. Then, line 86 will show negative figures up to year 6 included as WCR is up each year, then positive figures starting year 7 when sales start declining and the WCR, too. As the WCR starts from 0 and ends to 0, you check that the sum of all figures from B86 to L86 is zero.
What is the cash flow in year 6
CorrectIncorrect -
Question 9 of 12
9. Question
What is the cash impact of the change in WCR year 8?
Consider the after-tax residual value of the machine in year 10 is the same process as Step 4.2 (don’t forget to add the after-tax residual value to the cash flow year 10…).
Then, you calculate the NPV by discounting the total cash flows and accumulating them.
CorrectIncorrect -
Question 10 of 12
10. Question
What is the discounted cash flow in year 8?
CorrectIncorrect -
Question 11 of 12
11. Question
What is the NPV of the project?
CorrectIncorrect -
Question 12 of 12
12. Question
What is its payback (in years)?
CorrectIncorrect