Exercise / Step 7 / Real options – staged investment
Tools to understand the implementation of real options.
Step 6 has highlighted the fact that sensitivity analysis reveals threats and opportunities. Protecting the firm from threats is of utmost importance, but companies should be prepared for upside opportunities as well. If not, they miss value creating projects and progressively lose any competitive advantage.
Still, being prepared to grasp opportunities needs careful economic analysis in order to avoid over-investing in non-necessary capacity.
Step 6 mentioned the case of preparing the firm for upside.
To illustrate another value creating process based on uncertainty on volumes and a powerful illustration of the real option concept, we envisage to adopt a different perspective on capacity. Again, we will know later the actual volume, but we must take a decision today.
Two alternatives: either immediately invest in the maximum capacity as if the market gives its full potential, or invest in some initial capacity and upgrade just if needed. Of, course, the second alternative is costlier and disturbing for business operations, but, under some circumstances, it might be significantly better.
We consider a project with two different volume expectations, one capped at 5,000 units per year, another capped at 9,000. You will know which actual volume you will eventually produce only in year 3. Then, you have to decide if you invest in full capacity now (machine = $ 3.2M) or of you invest only $ 2.2M today, which might need an upgrade of $ 1.5M in year 3 if needed. Of course, 2.2 + 1.4 = 3.6, more than 3.2.
Download and open the frame spreadsheet document.
The frame provides any information you need in terms of units (per year), selling price, fixed and variable costs, WACC and corporate tax rate. No WCR, no inflation to simplify the calculation.
The following graph illustrates the risk on the volume:
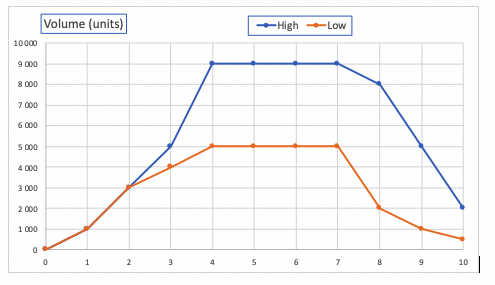
Year 3, you will eventually know if 5,000 unit-capacity is enough or if you need to go up to 9,000.
You, first, forecast the financials, then calculate the NPV for both alternatives and scenarios.
I suggest you start with the first alternative: you invest in a machine which has the full capacity to produce 9,000 units.
You evaluate the NPV with the two different scenarios. Make all calculations in $k.
First, copy-paste the Volume – High (C14:L14) in the ‘Forecast statements’ volume cells, i.e. C34:L34.